Sometimes the Purchase invoicing department has complained that posting took a very long time to complete. We could correlate this with the slow performing SQL statements alert explained in my previous post to identify the cause, now it is time to improve AX performace by fixing bad Query plans. My colleague, Peter Prokopecz provided some great insights on resolving this problem.
Either an AX trace, or the SQL alert could reveal the bad code. In our case it was the standard functionality of matching Tax transactions with the General journal entries, which can be found in \Data Dictionary\Tables\TaxTransGeneralJournalAccountEntry\Methods\create. It is a very large insert_recordset statement with multiple inner and exists joins:
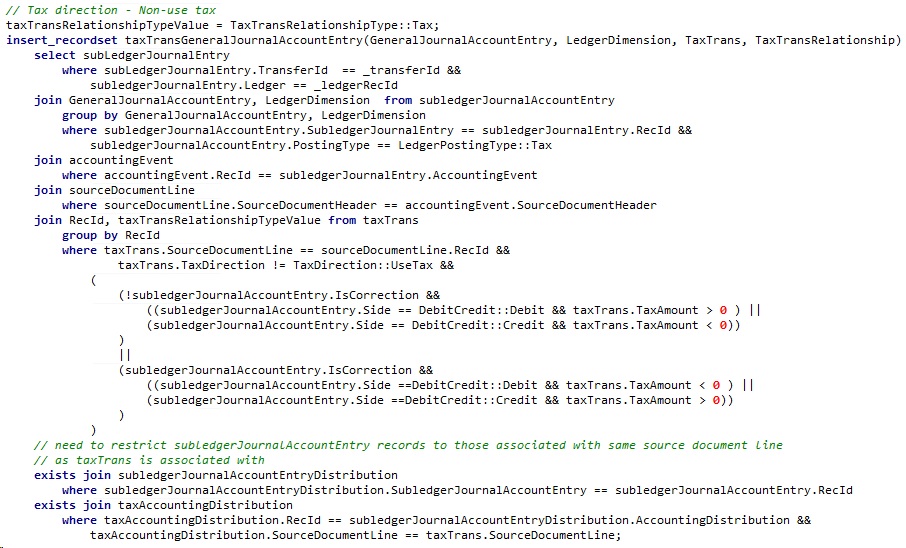
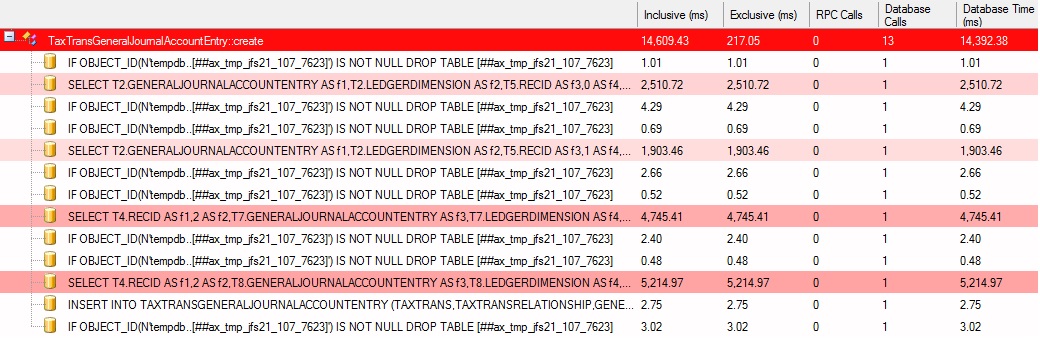
It is interesting that the AX kernel stores the values in a TempDB table first after emptying it, then writes the contents in their final place and drops TempDB contents again. There are 4 different similarly structured set-based statements in our method, writing different tax relations. This Trace parser entry shows that it has only generated actual records in the 4th statement and took an awful lot of time to finish:
The following T-SQL script could be used to reveal the last couple Query plans executed for the code above:
-- FIND QUERY PLAN BELONGING TO A STATEMENT WITH TIMEOUT, OR HIGH OPTIMIZER COMPILE TIME
WITH XMLNAMESPACES(DEFAULT 'http://schemas.microsoft.com/sqlserver/2004/07/showplan')
SELECT TOP 10 qt.text, qp.query_plan, compile_time = c.value('(QueryPlan/@CompileTime)[1]', 'int'), creation_time, last_execution_time, execution_count
FROM sys.dm_exec_query_stats qs
CROSS APPLY sys.dm_exec_sql_text (qs.[sql_handle]) AS qt
CROSS APPLY sys.dm_Exec_query_plan(qs.plan_handle) AS qp
CROSS APPLY qp.query_plan.nodes('ShowPlanXML/BatchSequence/Batch/Statements/StmtSimple') AS N(c)
WHERE qt.text LIKE '%GROUP BY T4.RECID,T8.GENERALJOURNALACCOUNTENTRY,T8.LEDGERDIMENSION ORDER BY T4.RECID,T8.GENERALJOURNALACCOUNTENTRY,T8.LEDGERDIMENSION'
	AND (qp.query_plan.exist('ShowPlanXML/BatchSequence/Batch/Statements/StmtSimple/@StatementOptmEarlyAbortReason[.="TimeOut"]') = 1
		OR c.value('(QueryPlan/@CompileTime)[1]', 'int') > 5000)
ORDER BY last_execution_time DESC
There is a trick where you could right click and select Properties of the Select/Insert/Update/Delete operation node at the beginning of the visualized plan, and that gives additional information about the time it took for the query optimizer to figure out what is the best way to retrieve the data, how many rows are returned, and whether the optimizer could complete arranging the joins within a reasonable timeframe.
If you see a “Reason for early termination = TimeOut” there, you could be sure that there is something wrong with your AX code or indexes. Same goes if the Compile time, or the number of rows retrieved are too high.
In our case the solution was to reduce the number of joins. In the Query plan there was an index seek on TaxTrans.I_440SOURCEDOCUMENTLINEIDX, then a key lookup for TaxTrans.I_440RECID, to retrieve the field content of TaxBaseAmount for additional filtering. We could just add TaxBaseAmount to the SourceDocumentLine index on TaxTrans table as an included column, which has simplified the query plan considerably. This has lowered the query optimizer compile time from several seconds to <200 ms.
Under the following link there is a script, which can show your highest compile time statements in detail, so you may find entries similar to our tax posting problem in your environment. It actually has revealed that 9 times out of 10 this tax posting was the slowest query indeed. Please pay close attention to the health of your database and improve AX performance by fixing bad Query plans.
[…] post Improve AX performace by fixing bad Query plans appeared first on DAXRunBase blog by Vilmos […]
[…] Improve AX performace by fixing bad Query plans […]
In query it has only taxamount no taxbaseamount
There were multiple statements in the create method and the one in the screenshot does not have the field indeed. However, in R3 they have split it up to multiple calls, please check the createForProfitAndLossZeroTax() method on the table, it has taxTrans.TaxBaseAmount validated against a 0 value in the where clause for the subledgers.